How to read your domain dashboard
A walkthrough of every section in the domain detail view: alignment, senders, DNS posture, health, and alerts.
The domain dashboard is the main view for a single domain. It shows your current DMARC alignment health, which services are sending on your behalf, and whether your DNS configuration is set up correctly. Every section updates daily as new aggregate reports arrive.
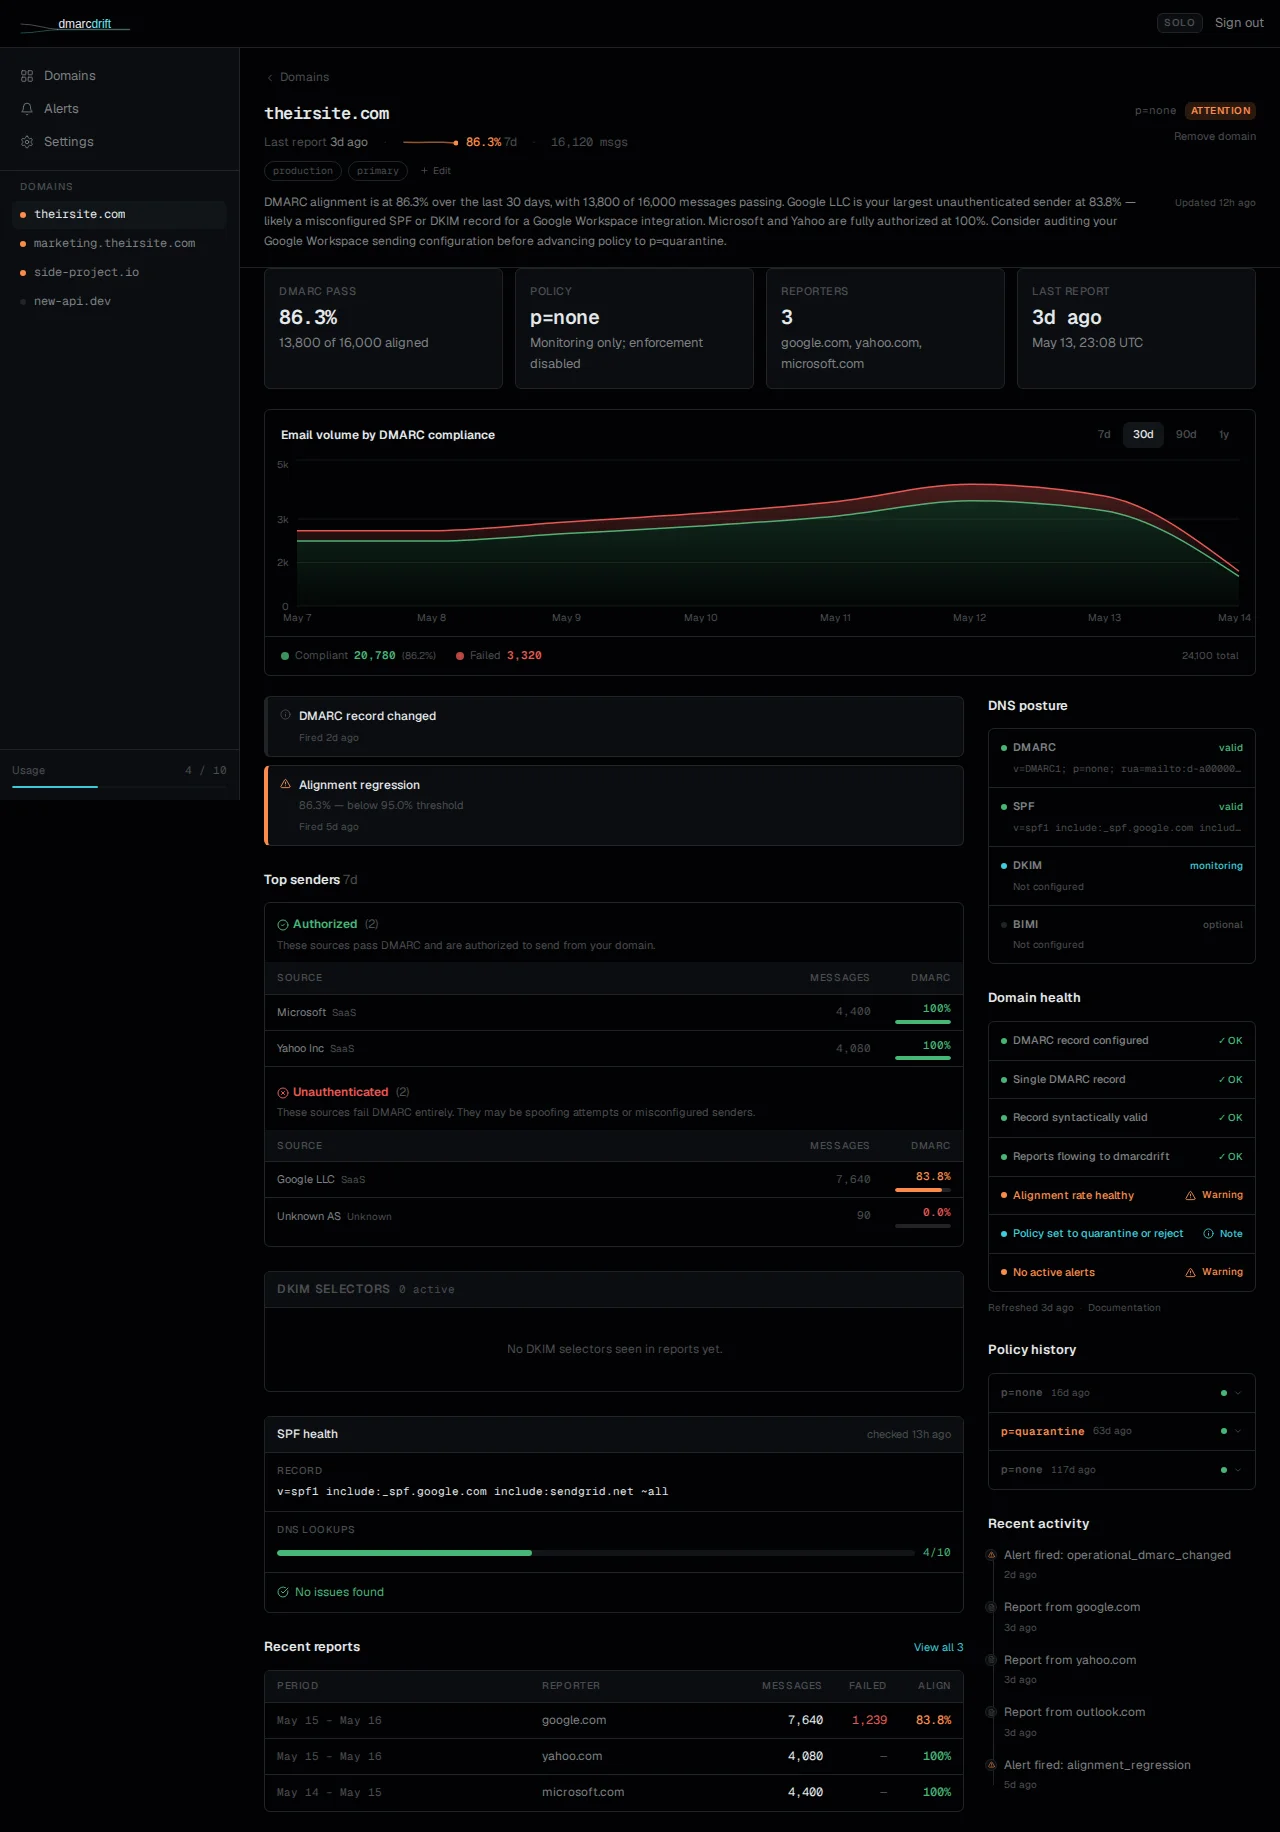
The summary section
At the top of the dashboard, DMARCdrift shows a brief plain-language summary of your domain's current state. This paragraph is generated from your aggregate report data and identifies your largest unauthenticated senders, your overall alignment rate, and any issues worth investigating.
Below the summary, four metric cards show key numbers for the last 30 days: total messages reported, aligned messages, alignment rate as a percentage, and the number of distinct reporters who sent data.
Alerts and fix guidance
When DMARCdrift detects a problem (an alignment regression, spoofing signal, or operational issue), the alert appears above the maturity card in the left column. Each alert includes a plain-language explanation specific to your domain's data: which senders are involved, what the numbers mean, and what to do next.
If your domain has active alignment failures, a Steps to fix section appears below the alerts. Expand it for numbered instructions targeting the specific senders causing failures, with ESP-specific guidance where applicable (for example, how to enable DKIM in Mailchimp or configure a custom MAIL FROM in Amazon SES). This section updates weekly as your sender data changes.
DMARC maturity and policy progression
The maturity card shows where your domain sits in the DMARC enforcement journey: Monitor → Quarantine → Enforce → BIMI-ready. When your alignment rate has been consistently above 95% for long enough to safely advance, the card shows a readiness assessment telling you exactly what to change (p=none to p=quarantine, or p=quarantine to p=reject) and why it's safe to do so based on your actual traffic data.
Alignment trend
The chart shows your alignment rate over time. Each point represents one day. The line shows the percentage of messages that passed DMARC alignment for that day.
Look for:
- A steady line near 100%: healthy; all known senders are passing.
- A sudden drop: usually a configuration change such as a DKIM key rotation not reflected in DNS, or a new sender that started without DMARC setup.
- A gradual decline: often indicates slowly increasing traffic from an unauthenticated source.
- Gaps: days with no data mean no aggregate reports arrived, which is normal for low-volume days.
Sending sources
The sources table shows every IP range that sent mail claiming to be from your domain, as reported by receivers. For each source: message count, how many passed DMARC alignment, and whether SPF and DKIM authenticated.
Sources are grouped by IP block and labeled by the organization that owns the range. If a source includes a DKIM signature with a recognizable d= domain, the signing domain is shown alongside.
A source with a high message count and zero alignment is worth investigating first. See how to review sending sources.
Right column: DNS posture, domain health, policy history
DNS posture shows your current published records (DMARC, SPF, DKIM, and BIMI) and whether each is valid, missing, or in a warning state. This reflects what's in DNS right now, checked daily.
Domain health is a readiness checklist. Unlike DNS posture (which shows what exists), the health checklist shows whether what exists is working correctly for DMARC purposes. A domain can have a valid DMARC record and still have alignment issues that the health checklist surfaces.
Policy history shows a timeline of detected changes to your DMARC p= value. Each entry is a change detected by the daily DNS poll, useful for correlating a configuration change with a shift in your alignment rate.
See DNS posture vs domain health and using policy history for walkthroughs of each panel.
See also: What your alignment rate means: how the percentage is calculated and what moves it. How to review sending sources: identifying unknown sources and deciding what to do.
Billing and plan limits
Overview of Free, Solo, and Pro plan limits in DMARCdrift: domain caps, report retention, how limits are enforced, and how to change your plan.
What your DMARC alignment rate means
What the alignment percentage measures, why 100% isn't always immediate, and what to investigate when it drops.